Analyze Azure Infrastructure using Azure Monitor Logs
Features of Azure Monitor Logs
Azure Monitor is a service for collecting and analyzing telemetry. It helps achieve maximum performance and availability for both cloud and on-premises applications and resources. Azure Monitor shows how applications are performing and identifies any occurring issues.
Data Collection in Azure Monitor
Azure Monitor collects two main types of data:
- Metrics: Provide information about the performance of a resource and resource consumption.
- Logs: Contain records of events such as when a resource is created or modified.
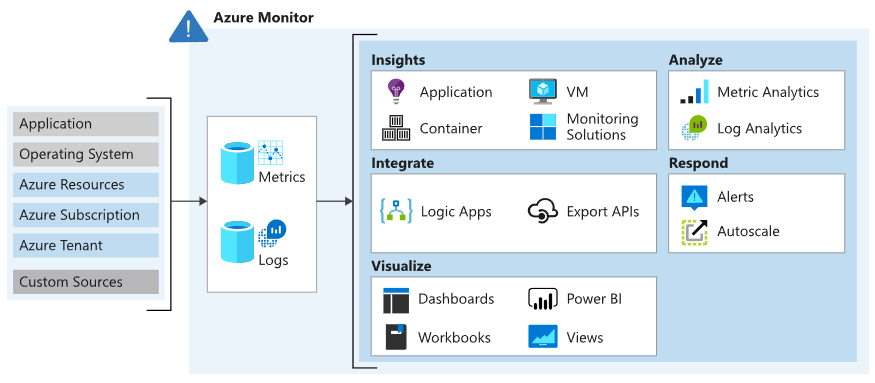
A high-level diagram of Azure Monitor architecture shows:
- Left: Monitoring data sources (Azure, OS, and custom sources)
- Center: Data storage for metrics and logs
- Right: Functions such as analysis, alerting, and data streaming
- Azure Monitor automatically collects data from various components, including:
- Application data: Information from custom application code
- Operating system data: From Windows or Linux VMs running the application
- Azure resource data: For example, web apps, load balancers
- Azure subscription data: Includes availability and health status
- Azure tenant data: Organization-wide services like Microsoft Entra ID
Because this system works automatically, Azure Monitor starts collecting data as soon as you create resources such as VMs and web apps.
- Extending Data Collection
You can expand data coverage by:
- Enabling diagnostics: For example, on Azure SQL Database to access full information
- Adding agents: Install the Log Analytics agent on VMs to send data to a Log Analytics Workspace
- Sending Data from Custom Applications
Developers can send data from custom applications (e.g., web apps, Azure Functions, or mobile apps) to Azure Monitor using the Data Collector API
(a REST API via HTTP). This API supports various frameworks such as:
- .NET Framework
- Node.js
- Python
- Logs
Logs store timestamped information about changes to resources. Each log is structured as a record with varying attributes depending on the source. Logs may include:
- Numeric values (e.g., Azure Monitor metrics)
- Text data (more common)
The most common type of log is an event record—which can occur randomly. Applications and services that create events also provide their context.
Logs can be stored in a Log Analytics Workspace, which offers:
- A powerful analytics engine
- A robust query language for data exploration
Logs are useful for conducting root cause analysis.
- Metrics
Metrics are numeric values that describe the condition of a system at a specific point in time. Azure Monitor features:
- Near real-time metric capture
- Collection at fixed intervals
- Ideal for high-frequency alerting
Metrics are stored in a time-series database, making them suitable for:
- Time-based data analysis
- Fast detection of anomalies or system issues
Metrics can also be combined with logs for deeper analysis.
Analyzing Logs with Kusto
To retrieve and analyze data, you can write queries using the Kusto Query Language (KQL), which is also used by Azure Data Explorer.
- Features:
- Test queries interactively in the Azure portal
- Start with basic queries and build up to complex ones
- Query results can be displayed in charts, tables, and embedded in custom dashboards
Azure Monitor provides dashboard tiles for visually displaying query results.
Use case example: The operations team can consolidate monitoring data into graphs and tables for cross-team reporting.
- Azure Dashboards
Azure dashboards allow:
- Combining logs and metrics in a single view
- Adding tiles such as:
- Metric charts
- Activity log tables
- Kusto query outputs
- Other visual elements
These dashboards are useful for communicating monitoring insights to various audiences, all within one integrated screen on the Azure portal.
By understanding logs, metrics, and query capabilities in Azure Monitor, users can build monitoring solutions that are robust, adaptive, and automated.
Creating a Basic Azure Monitor Log Query
You can use Azure Monitor log queries to extract information from log data.
This querying process is a key part of analyzing data collected by Azure Monitor.
Example Scenario:
The operations team uses Azure Monitor log queries to check the health of their systems.
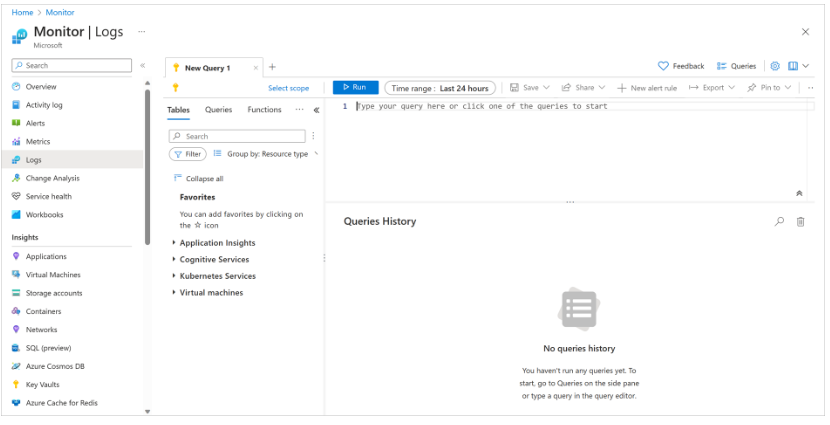
Writing Azure Monitor Log Queries with Log Analytics
You can find the Log Analytics tool in the Azure portal and use it to run sample queries or create your own.
Steps:
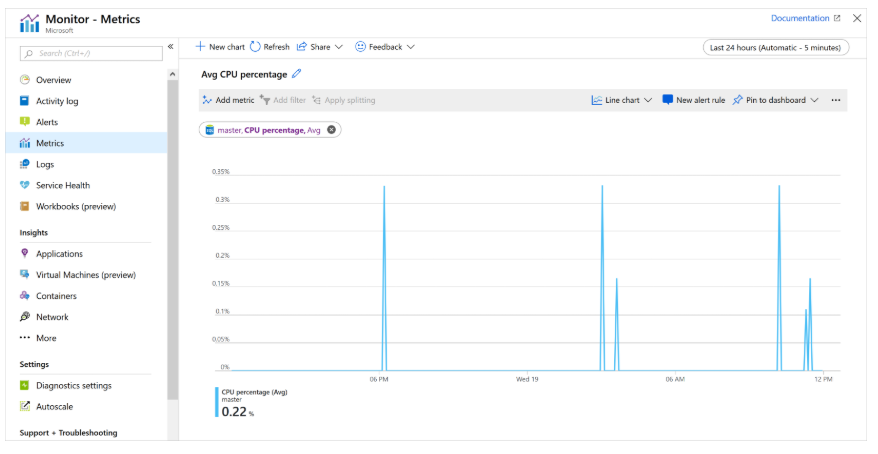
- In the Azure portal, from the left-hand menu, select Monitor.
- The Azure Monitor page appears with options like:
- Activity Log
- Alerts
- Metrics
- Logs
- Select Logs.
- You can now enter queries and view the results.
Writing Queries with Kusto Language
You can use the Kusto Query Language (KQL) to run queries against log data from your Azure services.
Kusto queries are read-only requests that process data and return results.
KQL Characteristics:
- Written in plain text
- Follows a readable and automatable data-flow model
- Uses schema entities such as: database, table, and column
- Queries are separated with semicolons (
;) - At least one statement must be a tabular expression statement
Tabular Expression Query Structure
A tabular expression query flows data from one operator to the next, starting from a data source, such as:
- A table in the database
- An operator that generates data
The data then flows through a series of data transformation operators, connected by the pipe symbol (|).
Simple Query Example
Events
| where StartTime > ago(1h)
| where State == "Error"
| count
Explanation:
Events: the source tablewhere: filters based onStartTimeandStatecolumnscount: counts the number of filtered rows
Additional Log Data Sources
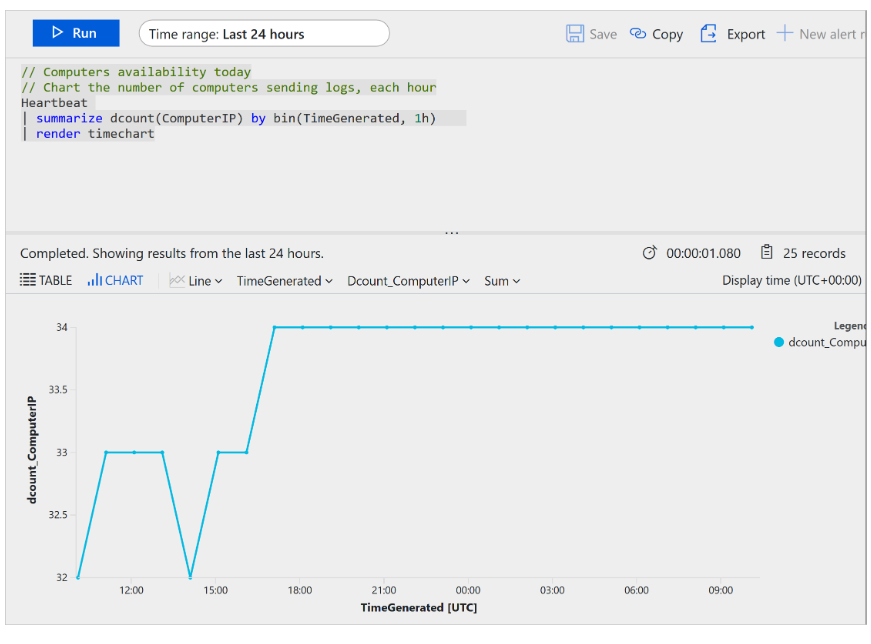
Events from monitored computer logs are just one type of data source. Azure Monitor supports many other types, such as:
- Heartbeat: Provides health status of all computers reporting to the Log Analytics Workspace
- Performance counters
- Update management records
Heartbeat Query Example
The following query retrieves the most recent heartbeat record for each computer based on its IP address:
Heartbeat
| summarize arg_max(TimeGenerated, *) by ComputerIP
Explanation:
summarize arg_max: gets the maximum value ofTimeGeneratedfor eachComputerIP- Returns one latest heartbeat record per computer IP
By understanding the basics of writing KQL queries, users can begin exploring logs and metrics in Azure to gain valuable insights into system performance and health.
Example Kusto Query
For instance, the following Kusto query has a single tabular expression statement. It starts by referencing a table named Events.
The hosting database is implicit and part of the connection information. Data in the table (stored in rows) is filtered by StartTime and further filtered by the State column.
The query then returns the count of resulting rows.
Events
| where StartTime >= datetime(2018-11-01) and StartTime < datetime(2018-12-01)
| where State == "FLORIDA"
| count
The Kusto query language used by Azure Monitor is case-sensitive. Language keywords are usually lowercase. When using table or column names in a query, ensure the correct casing is used.