Introduction to Azure Monitor
Monitoring and Azure Monitor
The goals of monitoring include:
- Ensuring applications and environments run optimally, securely, and reliably.
- Detecting and helping resolve arising issues.
Key monitoring activities:
- Data collection: Metrics, logs, and trace logs providing insights into the functionality and performance of monitored components.
- Data analysis: Understanding current conditions, predicting potential issues, and identifying patterns, trends, and anomalies.
- Alerts: Triggered when certain conditions are met, such as high CPU usage or low disk space.
- Visualization: Presenting data in an easily understandable visual format to enable quick system evaluation.
- Diagnostics and troubleshooting: Helping identify root causes and inform decisions for resolution.
Benefits of monitoring:
- Performance and cost optimization: Identifying performance bottlenecks and opportunities to increase efficiency.
- Proactive management: Preventing disruptions before they occur.
- Reliability: Enabling quick recovery during issues.
- Capacity planning: Analyzing usage patterns to support planning and scalability.
- Security monitoring: Detecting threats and suspicious activity.
- Compliance and governance: Ensuring adherence to standards and regulations.
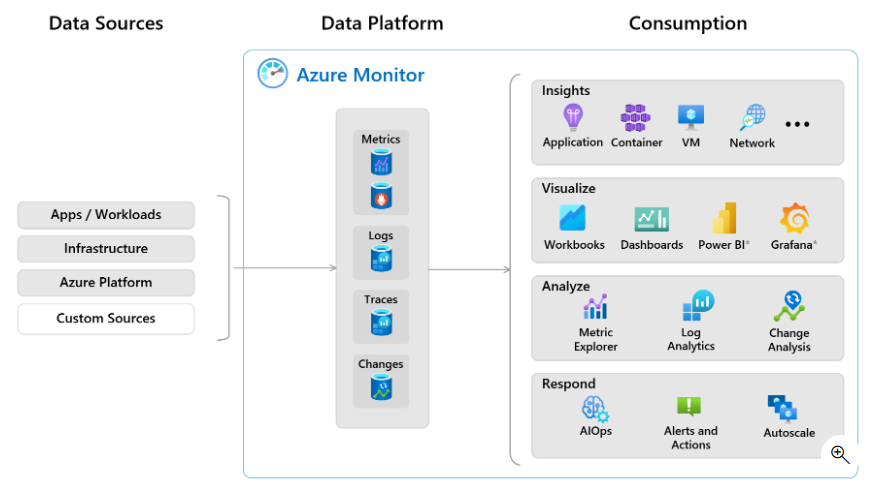
Azure Monitor Overview
When users run applications built on various services and resources, it's essential to connect application performance and health to the underlying components. This observability enables effective analysis and problem-solving.
Azure Monitor provides features and tools to collect, manage, and analyze IT data across Azure resources, other cloud services, and on-premises environments.
Data Collection and Storage
Once users add resources to an Azure subscription, Azure Monitor begins data collection. Key features for data collection and management include:
- Native monitoring for all Azure implementations.
- Data collection agents and APIs for all stack layers (application and infrastructure, inside and outside Azure).
- Integration with Azure Event Hubs for streaming data.
- Ingestion-time data transformation to filter unnecessary data.
- Data retention configuration, archiving, and recovery options.
- Volume-based pricing discounts.
- Low-cost Basic logs tier for high-volume logs (debugging, auditing, troubleshooting) — not for analysis or alerts.
Data Analysis and Response
Azure Monitor offers tools to analyze and gain insights from monitoring data, including:
- User-friendly portal interface for viewing, filtering, and manipulating monitoring data.
- Kusto Query Language (KQL) — optimized for fast analysis and data exploration across sources.
- Tools for custom analysis, visualization, notifications, and response actions.
- Built-in alert recommendations.
- Ready-to-use monitoring experiences with advanced analytics and visualizations.
- Autoscale to adjust resources based on application load.
- Built-in AI and machine learning to detect and respond to anomalies.
Alerts, Workbooks, and Visualization
Interactive monitoring is one way to observe applications. Another is to configure alerts to send text messages or emails to teams for investigation. Users can also trigger automated response actions.
Workbooks
Azure Monitor provides workbooks, flexible canvases for analyzing data and creating rich visual reports in the Azure portal. Workbooks can pull data from multiple Azure sources into unified, interactive views.
Users can:
- Use built-in workbooks from Azure Monitor.
- Create new workbooks from available templates.
Visualizations created in Azure Monitor can be added to Azure dashboards, enabling users to consolidate various data into a single view within the Azure portal.
Metrics and Logs
Metrics
Metrics are quantitative measurements representing a snapshot of application or resource performance. Typically numeric, they are recorded over time.
Metrics offer insight into aspects such as:
- Resource utilization
- Response times
- Error rates
- Throughput
Common metrics include:
- CPU usage
- Memory usage
- Network latency
- Transaction rate
Accessing Metrics
Each resource type in Azure automatically provides a specific set of metrics.
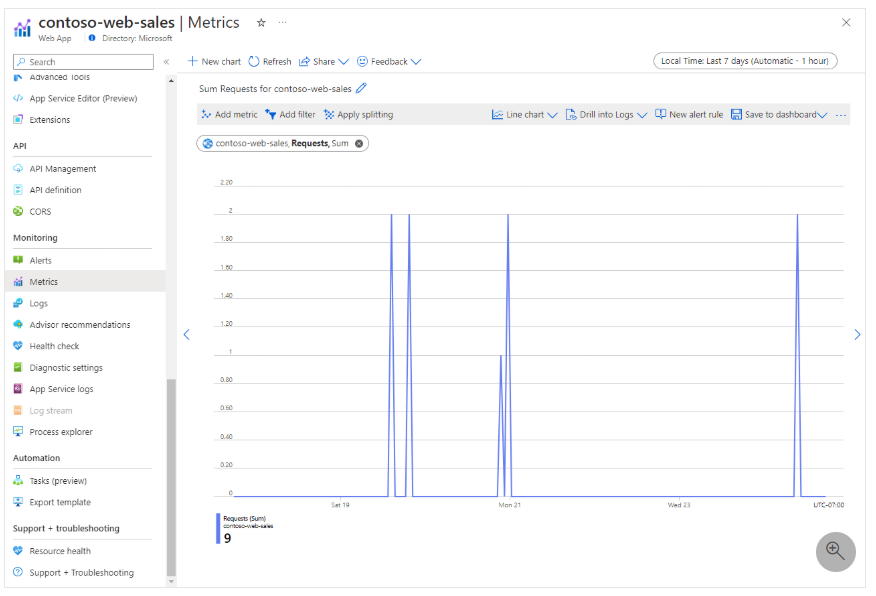
Use Azure Monitor Metrics Explorer to:
- Interactively analyze metric data
- Create charts showing metric values over time
In the Azure portal:
- Open the resource page.
- Select Metrics under Monitoring.
- Choose the desired metric from the dropdown menu.
- Pin the chart to a dashboard if needed.
Example: A line chart of Requests metric showing aggregated request counts for the Contoso-web-sales app.
Types of Metrics in Azure Monitor
Azure Monitor can collect several types of metrics, including:
- Azure platform metrics: Automatically collected when resources are added to a subscription.
- Custom metrics: From applications or agents on VMs. Sent via Azure Monitor Agent, extensions, or REST API.
- Prometheus metrics: Managed Azure Monitor for Prometheus collects metrics from AKS or other Kubernetes clusters. Supports integration with PromQL and Grafana.
Metrics are ideal for real-time monitoring and can trigger alerts when thresholds are reached.
Logs
Logs are textual records of events, actions, and messages generated by resources or applications.
Unlike numeric metrics, logs can include:
- Text: Human-readable entries providing context and event descriptions.
- Unstructured data: Entries in non-standard formats.
- Contextual info: Insights into the state during the event — useful for root cause analysis.
Logs may record:
- Errors
- Warnings
- User actions
- Application status changes
Logs are critical for:
- Troubleshooting
- Debugging
- Retrospective event analysis
Azure Monitor Logs
Azure Monitor Logs is a feature that allows storing, managing, and analyzing log and performance data from monitored resources.
Log Analytics Workspace
To start using logs:
- Create a Log Analytics workspace.
- Configure resources to send data to the workspace.
Once data is collected, users can explore and analyze logs via the interactive Log Analytics interface.
Log Queries
Users can use log queries for multiple scenarios:
- Answer common questions using basic queries
- Perform complex data analysis to find critical patterns
- Use queries in alert rules for proactive notifications
- Display query results in workbooks or dashboards
Understanding metrics and logs helps users monitor applications and infrastructure in real-time and historically, and proactively respond to issues.
Azure Monitor Insights, Visualizations, and Actions
Some Azure resource providers offer tailored visualizations for personalized monitoring experiences with minimal configuration. Insights are curated, scalable visualizations.
Types of Insights in Azure Monitor
In the Azure portal, select Insights Hub from Azure Monitor navigation to view available types.
a. Application Insights
Application Insights is an Azure Monitor feature for application performance monitoring (APM) from development to production. It enables users to:
- Proactively monitor application performance.
- Reactively investigate app execution data to identify root causes.
Key features of Application Insights:
- Metric & telemetry collection: Stores app activity and health data.
- Trace logging: Records application log traces for in-depth analysis.
- Distributed tracing: Tracks transactions across distributed or microservices-based applications.
- Live metrics: View real-time app activity with no hosting impact.
- Availability monitoring: Monitor external app endpoints (synthetic transactions).
- Usage monitoring: Learn user-favorite features and interactions.
- Smart detection: Automatically detect failures and anomalies.
- Application Map: Visual top-down architecture view of the app.
b. Container Insights
Container Insights provides performance visibility for container workloads in Azure Kubernetes Service (AKS) or Azure Container Instances. Metrics and logs are collected from nodes, controllers, and containers using the Metrics API and Log Analytics agent running in the container.
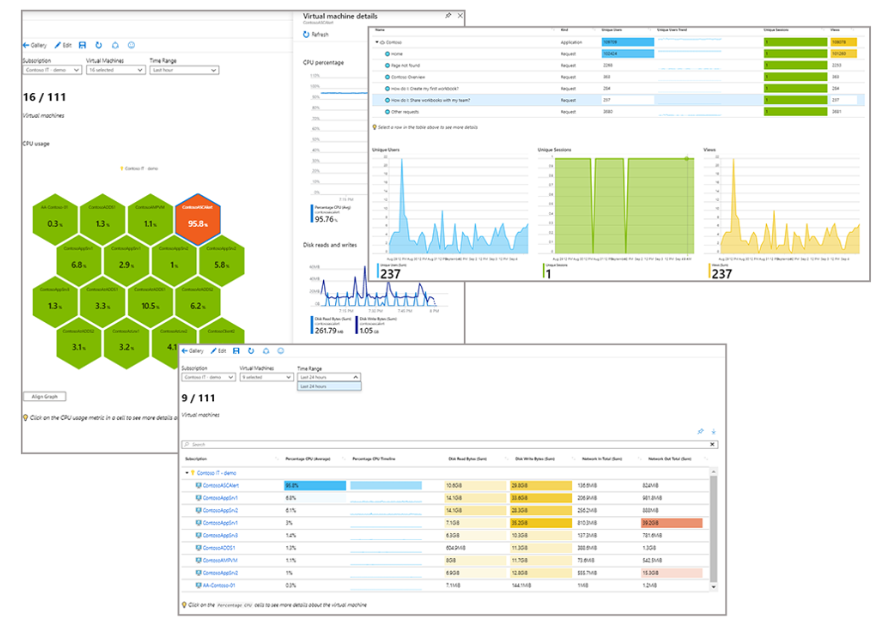
c. VM Insights
VM Insights monitors performance and health of Windows & Linux VMs in Azure, as well as on-premises or other cloud providers. Identifies VM processes, app dependencies, and related external processes.
d. Network Insights
Network Insights provides a comprehensive visual representation of the health and metrics of deployed network resources. Features include:
- Connection Monitor
- NSG flow logs
- Traffic Analytics
- Other network diagnostic tools
e. Visualizations
Visual tools such as charts and tables are effective for summarizing monitoring data. Azure Monitor offers built-in visualization features and integrations to present data to various audiences.
f. Workbooks
Workbooks are flexible canvases for:
- Data analysis
- Creating rich visual reports
- Combining data from multiple sources into one view
Workbooks are interactive, real-time updatable, and shareable across teams. Users can use:
- Built-in workbooks from Azure Monitor Insights
- Templates from the workbook gallery
- Custom workbooks they build themselves
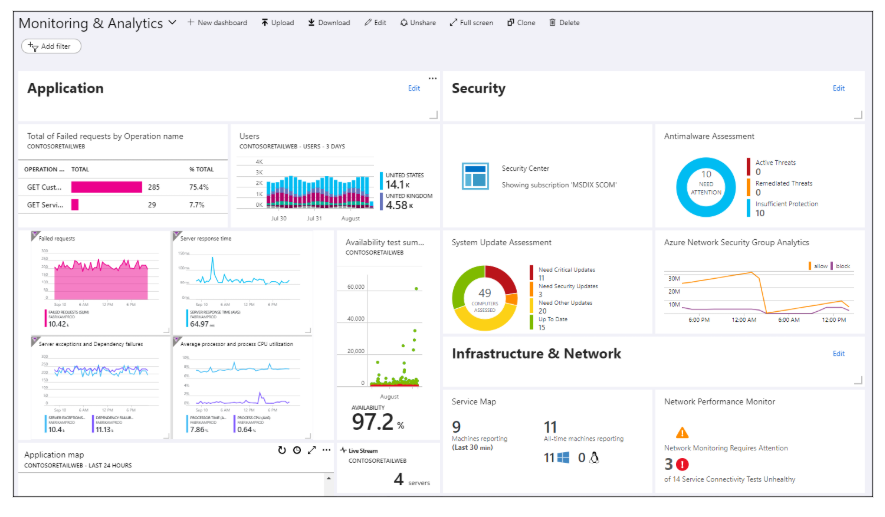
g. Dashboards
Dashboards allow users to consolidate various data types into a single view in the Azure portal. You can add:
- Log query output
- Metric charts
- Application Insights data
And share them with other Azure users.
h. Power BI
Power BI is a business analytics service offering interactive visualizations. Users can configure Power BI to automatically import log data from Azure Monitor — ideal for sharing data within or outside the organization.
i. Grafana
Grafana is an open platform for operational dashboards. Azure Monitor includes a built-in Grafana data source plugin. Azure Managed Grafana is optimized for data from Azure Monitor & Azure Data Explorer.
Grafana also supports plugins for third-party tools like:
- Dynatrace
- New Relic
- AppDynamics
- AWS CloudWatch
- GCP BigQuery
Actions
An effective monitoring solution can respond to critical events automatically, without manual intervention. Responses include:
- SMS/email notifications
- Automated processes to resolve issues
a. AIOps (Artificial Intelligence for IT Operations)
AIOps applies AI and ML to improve and automate IT operations. Azure Monitor uses AI to:
- Predict capacity usage
- Identify performance issues
- Detect anomalies
Even users without ML expertise can benefit. Those with ML skills can further analyze data using Azure Machine Learning.
b. Azure Monitor Alerts
Alerts notify about critical conditions and can initiate corrective actions. Types of alert rules:
- Metric alerts: Near real-time.
- Log alerts: Support complex logic from multiple data sources.
Alerts use action groups to perform actions such as:
- Email or SMS
- Webhooks for external processes
- Integration with IT service management (ITSM) tools
Action groups are reusable across alert rules.
c. Autoscale
Autoscale dynamically adjusts the number of resources based on application load. Users can configure:
- Minimum and maximum instances
- Logic for scaling in/out
- Cost savings or performance boosts based on Azure Monitor metrics
Understanding Azure Monitor Insights, visualizations, and actions empowers users to build proactive, integrated, and efficient monitoring systems.