Improving Incident Response with Azure Monitor Alerts
Exploring the Types of Alerts Supported by Azure Monitor
Azure Monitor is a powerful reporting and analytics tool. Users can leverage it to gain insight into the behavior and operations of environments and applications. This enables proactive response to system disruptions.
After experiencing downtime, the user sets up monitoring on key Azure resources. With monitoring enabled, they want to ensure the right people receive alerts at the appropriate level.
In this unit, you will learn how Azure Monitor receives resource data, what components make up an alert, and when and how to use alerts. Finally, you will learn how to create and manage your own alerts.
Types of Data in Azure Monitor
Azure Monitor collects data from target resources such as applications, operating systems, Azure resources, Azure subscriptions, and Azure tenants. The type of resource determines the type of data available. Data types may be metrics, logs, or both:
- Metrics focus on time-sensitive numeric values that represent specific aspects of the target resource.
- Logs focus on querying structured, record-based log file data.
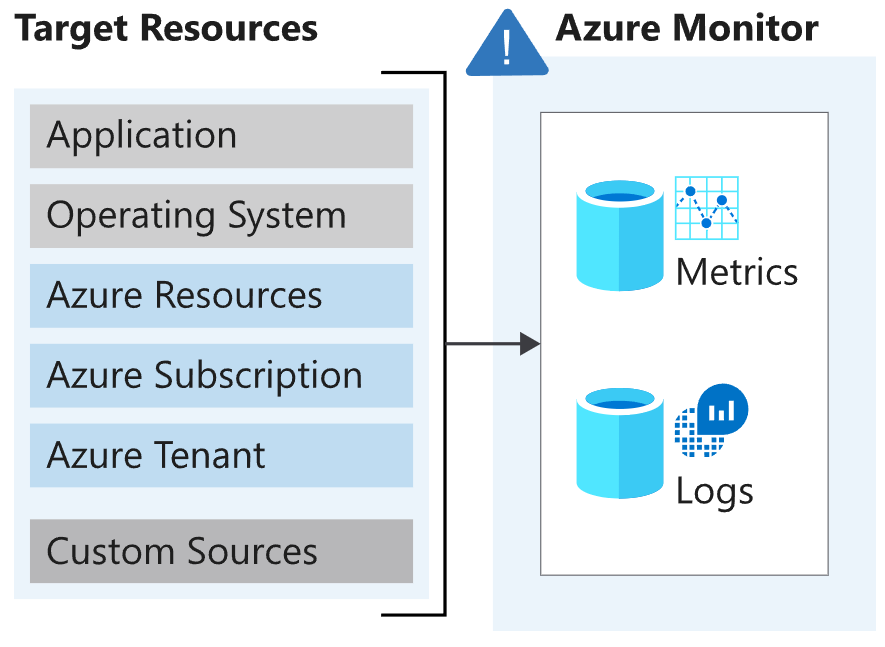
Diagram showing target resources streaming data to Azure Monitor and the two primary signal types: metrics and logs.
Three Types of Signals
- Metric alerts trigger when a certain threshold is exceeded. Example: CPU usage exceeds 95%.
- Activity log alerts notify when an Azure resource changes status. Example: a resource is deleted.
- Log alerts are based on data written in log files. Example: a web server returns too many 404 or 500 responses.
Alert Rule Composition
Every alert in Azure Monitor originates from a rule:
| Component | Description |
|---|---|
| RESOURCE | - The target resource(s) for the alert rule. You can assign multiple target resources to a single rule. The type of resource determines the available signal types. |
| CONDITION | - The signal type used to evaluate the rule: metric, activity log, or other logs. - Alert logic is applied to the data based on the signal type. The structure of the logic depends on the signal type. |
| ACTIONS | - The action taken, such as sending an email, SMS, or using a webhook. - Action groups, typically containing a unique set of recipients for that action. |
| ALERT DETAILS | - Alert name and description that define its purpose. - Alert severity level if criteria return true. Five levels: 0: Critical 1: Error 2: Warning 3: Informational 4: Verbose |
Alert Rule Scope
Azure Monitor allows users to create alert rules for a variety of triggers, such as:
- Metric values
- Log search queries
- Activity log events
- Azure platform health
- Website availability tests
Managing Alert Rules
Not all alert rules need to run indefinitely. You can enable or disable them as needed. A common practice is to enable alerts before application changes and disable them after successful deployment.
Alert Summary View
The alerts page provides a summary of all alerts. You can filter the view by:
- Subscription
- Alert condition
- Severity level
- Time range
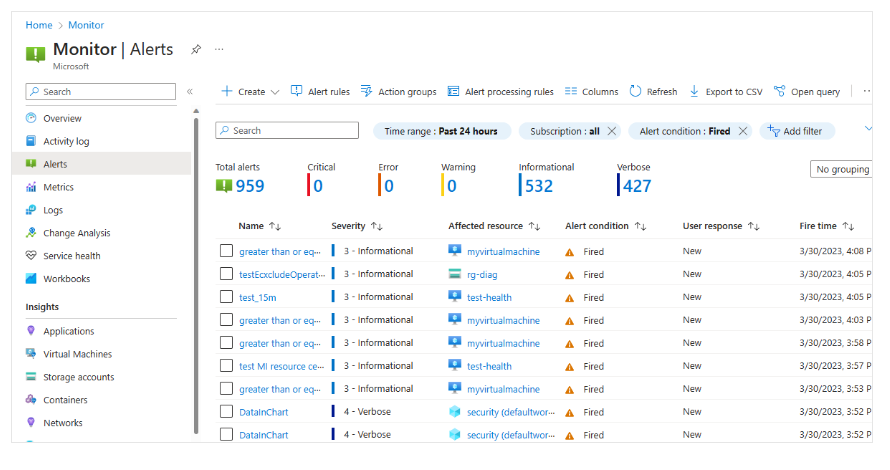
Alert Conditions
Alert conditions are automatically set by the system:
- When the alert is active: monitoring condition is Fired
- Once the triggering condition clears: condition changes to Resolved
Using Metric Alerts to Detect Performance Issues in the Azure Environment
As a solution architect, you want to apply threshold monitoring across many resources and target instances. Monitoring helps prevent potential issues before they impact customers.
When to Use Metric Alerts?
In Azure Monitor, users can use metric alerts for routine threshold monitoring of Azure resources. Azure Monitor evaluates the metric alert trigger condition on a set schedule. When the condition is met, it sends a notification.
Metric alerts are stateful—Azure Monitor only sends notifications if the initial condition is met.
Metric alerts are useful when you need to know if a server’s CPU usage reaches a critical threshold of 90%. You can also get alerts for near-full database storage or unacceptable network latency.
Metric Alert Composition
For metric alerts, there's an additional component to define: condition type, which can be static or dynamic.
Users must also specify the statistical analysis type—such as minimum, maximum, average, or total—and define the evaluation period (e.g., last 10 minutes) and the evaluation frequency (e.g., every 2 minutes).
Use Static Threshold Metric Alerts
Static metric alerts are based on simple, predefined thresholds.
| Aspect | Explanation |
|---|---|
| Type | Static |
| Description | Based on user-defined conditions and thresholds. |
| Threshold Setting | Manually defined by user. |
| Example Use Case | CPU usage threshold set at 85%. |
| Evaluation Frequency | Every 2 minutes. |
| Evaluation Period | Last 10 minutes. |
| Action After Evaluation | If usage exceeds threshold, the alert triggers the specified action group. |
Use Dynamic Threshold Metric Alerts
Dynamic metric alerts use Azure's built-in machine learning to automatically determine thresholds based on historical patterns.
| Aspect | Explanation |
|---|---|
| Type | Dynamic |
| Description | Uses Azure ML to auto-set thresholds based on trends. |
| Threshold Setting | No fixed value; determined dynamically. |
| Additional Parameters | - Look-back period: Number of past intervals to evaluate (e.g., 3 = 30 minutes). - Number of violations: How many violations trigger the alert (e.g., 2). |
| Advantage | Adaptive and better at anomaly detection. |
Understanding Dimensions
So far, we’ve only discussed alerts for a single target instance. Azure Monitor supports dimensions, allowing you to monitor many target instances.
Example: Monitor CPU usage across all servers running an app. You will receive individual alerts for each server instance that meets the rule condition.
You can define dimensions by naming each instance or use an asterisk (*) wildcard to include all instances.
Scaling Metric Alerts
Azure Monitor allows scaling metric alerts to monitor multiple resources, currently limited to Azure VMs in a single region.
For effective monitoring, design metric rules based on real scenarios and operational needs. Combine static and dynamic thresholds as needed.
Using Log Search Alerts to Detect Application Events
Azure Monitor can capture key data from log files. These logs may be generated by applications, OSes, hardware, or Azure services.
As a solution architect, you want to explore how log data monitoring can detect issues before they impact customers.
When to Use Log Search Alerts
Log search alerts use log data to evaluate rules and, if necessary, trigger alerts. These logs can originate from any Azure source: server logs, application server logs, or application logs.
Since logs are historical in nature, they're ideal for analysis and trends.
Example: Use this alert to check if any server exceeded a CPU usage threshold in the past 30 minutes, or to evaluate response codes returned by a web app over the past hour.
How Log Search Alerts Work
Log search alerts function slightly differently than other alert types. The first part of the alert defines the log search rule, including its evaluation frequency, time range, and the query to execute.
If the result meets the condition, the system creates an alert and triggers the corresponding actions.
Log Search Rule Components
Each log search alert has:
- Log query: Executed on each trigger
- Time range: Evaluation period for the query
- Frequency: How often the query runs
- Threshold: The condition for triggering the alert
Log search results are of two types:
| Log Search Type | Description | Criteria | Example |
|---|---|---|---|
| Number of Records | Used for event-based data like syslog or web responses. | - Threshold is based on row count. - Triggers if rows ≥ threshold. | Threshold ≥ 5 = query must return at least 5 rows to trigger. |
| Metric Measurement | Similar to metric alerts, but allows advanced analysis (aggregation, grouping). | - Aggregates like count, average.- Group by field, e.g., by computer. - Time interval: e.g., 10 min. - Threshold: based on aggregate and violation count. | If CPU > 85% for 5 times in a window, an alert is triggered. |
Metric measurement reduces alert volume significantly, but be cautious to avoid missing critical alerts.
- One major consideration is that log search alerts are stateless
(stateful log search alerts are in preview). - Stateless alerts always create new alerts when the criteria are met, regardless of previous alert state.
Using Activity Log Alerts to Detect Infrastructure Events
Activity log alerts let you receive notifications for specific events on Azure resources.
For example, get notified when someone creates a new VM in a subscription.
They can also cover Service Health alerts—helpful for knowing about service issues or planned maintenance, enabling faster response and greater stability (e.g., by sending an email or creating an ITSM ticket).
When to Use Activity Log Alerts
Activity log alerts are designed for Azure resources. Typically used to notify of specific changes in a subscription.
Two Types of Activity Log Alerts:
- Specific Operations: Applied to resources or resource groups.
Example: Alert when a VM is deleted or a role is assigned. - Service Health Events: Covers incident and maintenance events.
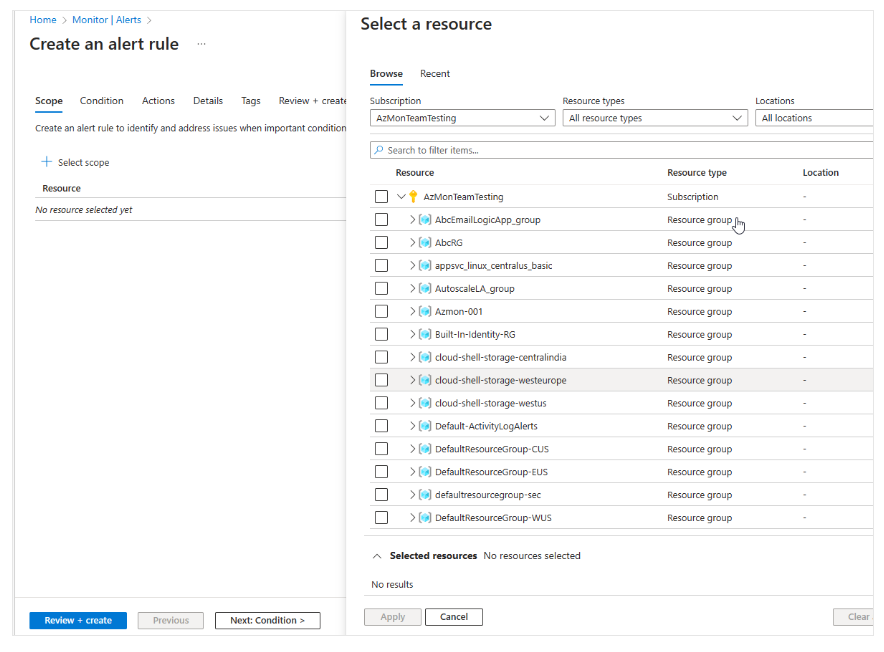
Activity Log Alert Composition
Note: These alerts only monitor events in the subscription where they are created.
Use Azure Monitor to filter all events in your subscription and click Add activity log alert.
These alerts have the following attributes:
- Category: Administrative, service health, autoscale, policy, recommendation
- Scope: Resource, resource group, or subscription level
- Resource Group: Where the alert rule is stored
- Resource Type: Target namespace
- Operation Name: Name of the action
- Severity Level: Verbose, informational, warning, error, or critical
- Status: Started, failed, or succeeded
- Triggered By: Email or Entra ID (formerly “caller”)
Creating Specific Resource Log Alerts
When creating the alert, select Activity Log as the signal type. You’ll then see all alerts available for that resource.
Example: Create an alert to trigger when a VM is shut down.
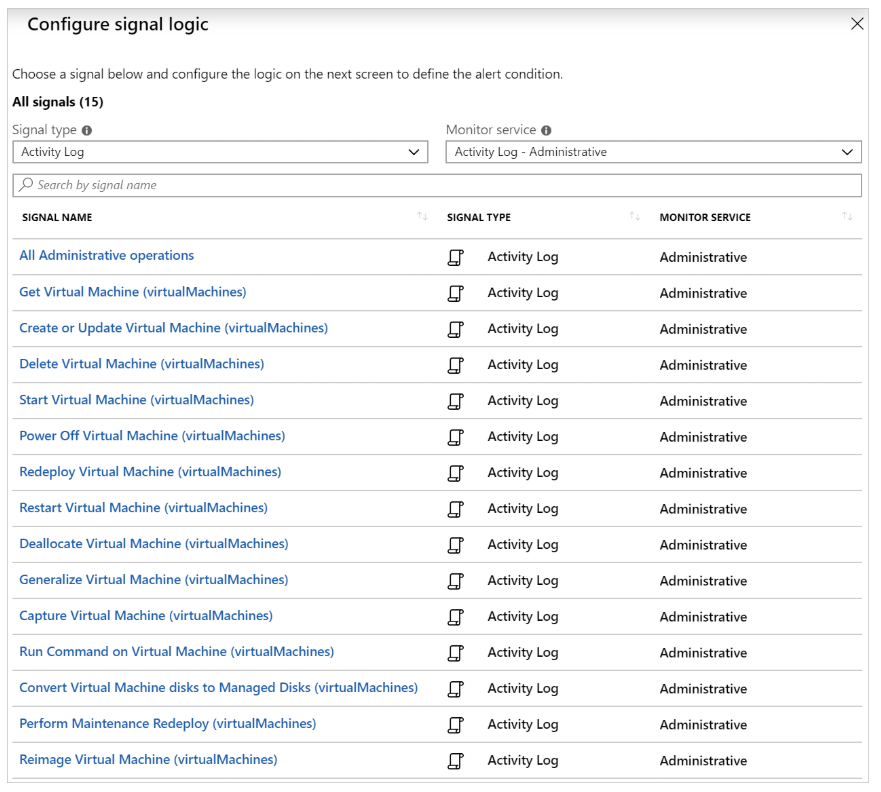
Use monitoring filters to narrow down options. Selecting Administrative shows only admin-related signals.
Creating Service Health Alerts
Service Health alerts differ slightly from the previous types.
To create them:
- Search and select Service Health in Azure portal.
- Choose Health alerts.
- Click Create service health alert.
The next steps are similar to other alerts.
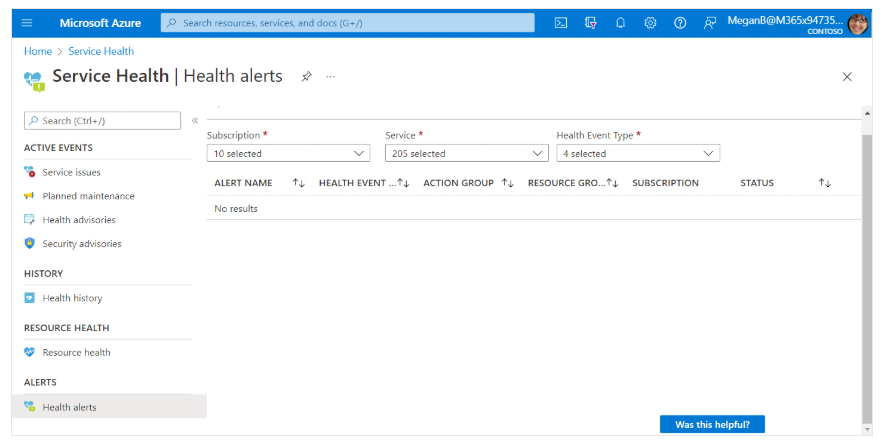
Key difference: No need to select specific resources—this applies across the entire Azure region.
Select the health event types to monitor:
- Service issues
- Planned maintenance
- Health advisories
- Or all of the above
Using Action Groups and Alert Processing Rules to Send Notifications
Azure Monitor, Azure Service Health, and Azure Advisor use action groups to notify users and take actions when alerts trigger.
An action group is a collection of notification preferences and actions triggered by an active alert.
Users can trigger one or more actions per alert.
Actions Supported by Azure Monitor
Azure Monitor supports:
- Sending emails
- Sending SMS messages
- Push notifications to Azure app
- Voice calls
- Calling an Azure Function
- Running a logic app
- Sending to a webhook
- Creating ITSM tickets
- Running a runbook (e.g., restart VM, scale up/down)
Once an action group is created, you can reuse it anytime.
Example: After creating one that emails the ops team, attach it to all service health events.
When creating an alert rule, you can:
- Create a new action group
- Attach an existing action group
- Edit an existing alert rule to add an action group
Alert Processing Rules
Use alert processing rules to alter default alert behavior, such as adding or suppressing action groups.
They differ from alert rules. While alert rules trigger alerts when conditions are met, processing rules modify alerts after they trigger.
Function of Alert Processing Rules
Users can use alert processing rules to:
- Suppress notifications during scheduled maintenance windows
- Apply large-scale management with common logic in a single rule, instead of adding the same logic to all alert rules
- Add an action group to all types of alerts
These rules can be applied to various scopes of resources, ranging from a single resource to an entire Azure subscription. Users can also add filters or schedule when the rules will be active.
Rule Activation Timing Settings
By default, these rules are always active, but users can also:
- Set a one-time window
- Schedule the rule to recur, for example, weekly recurrence